 The
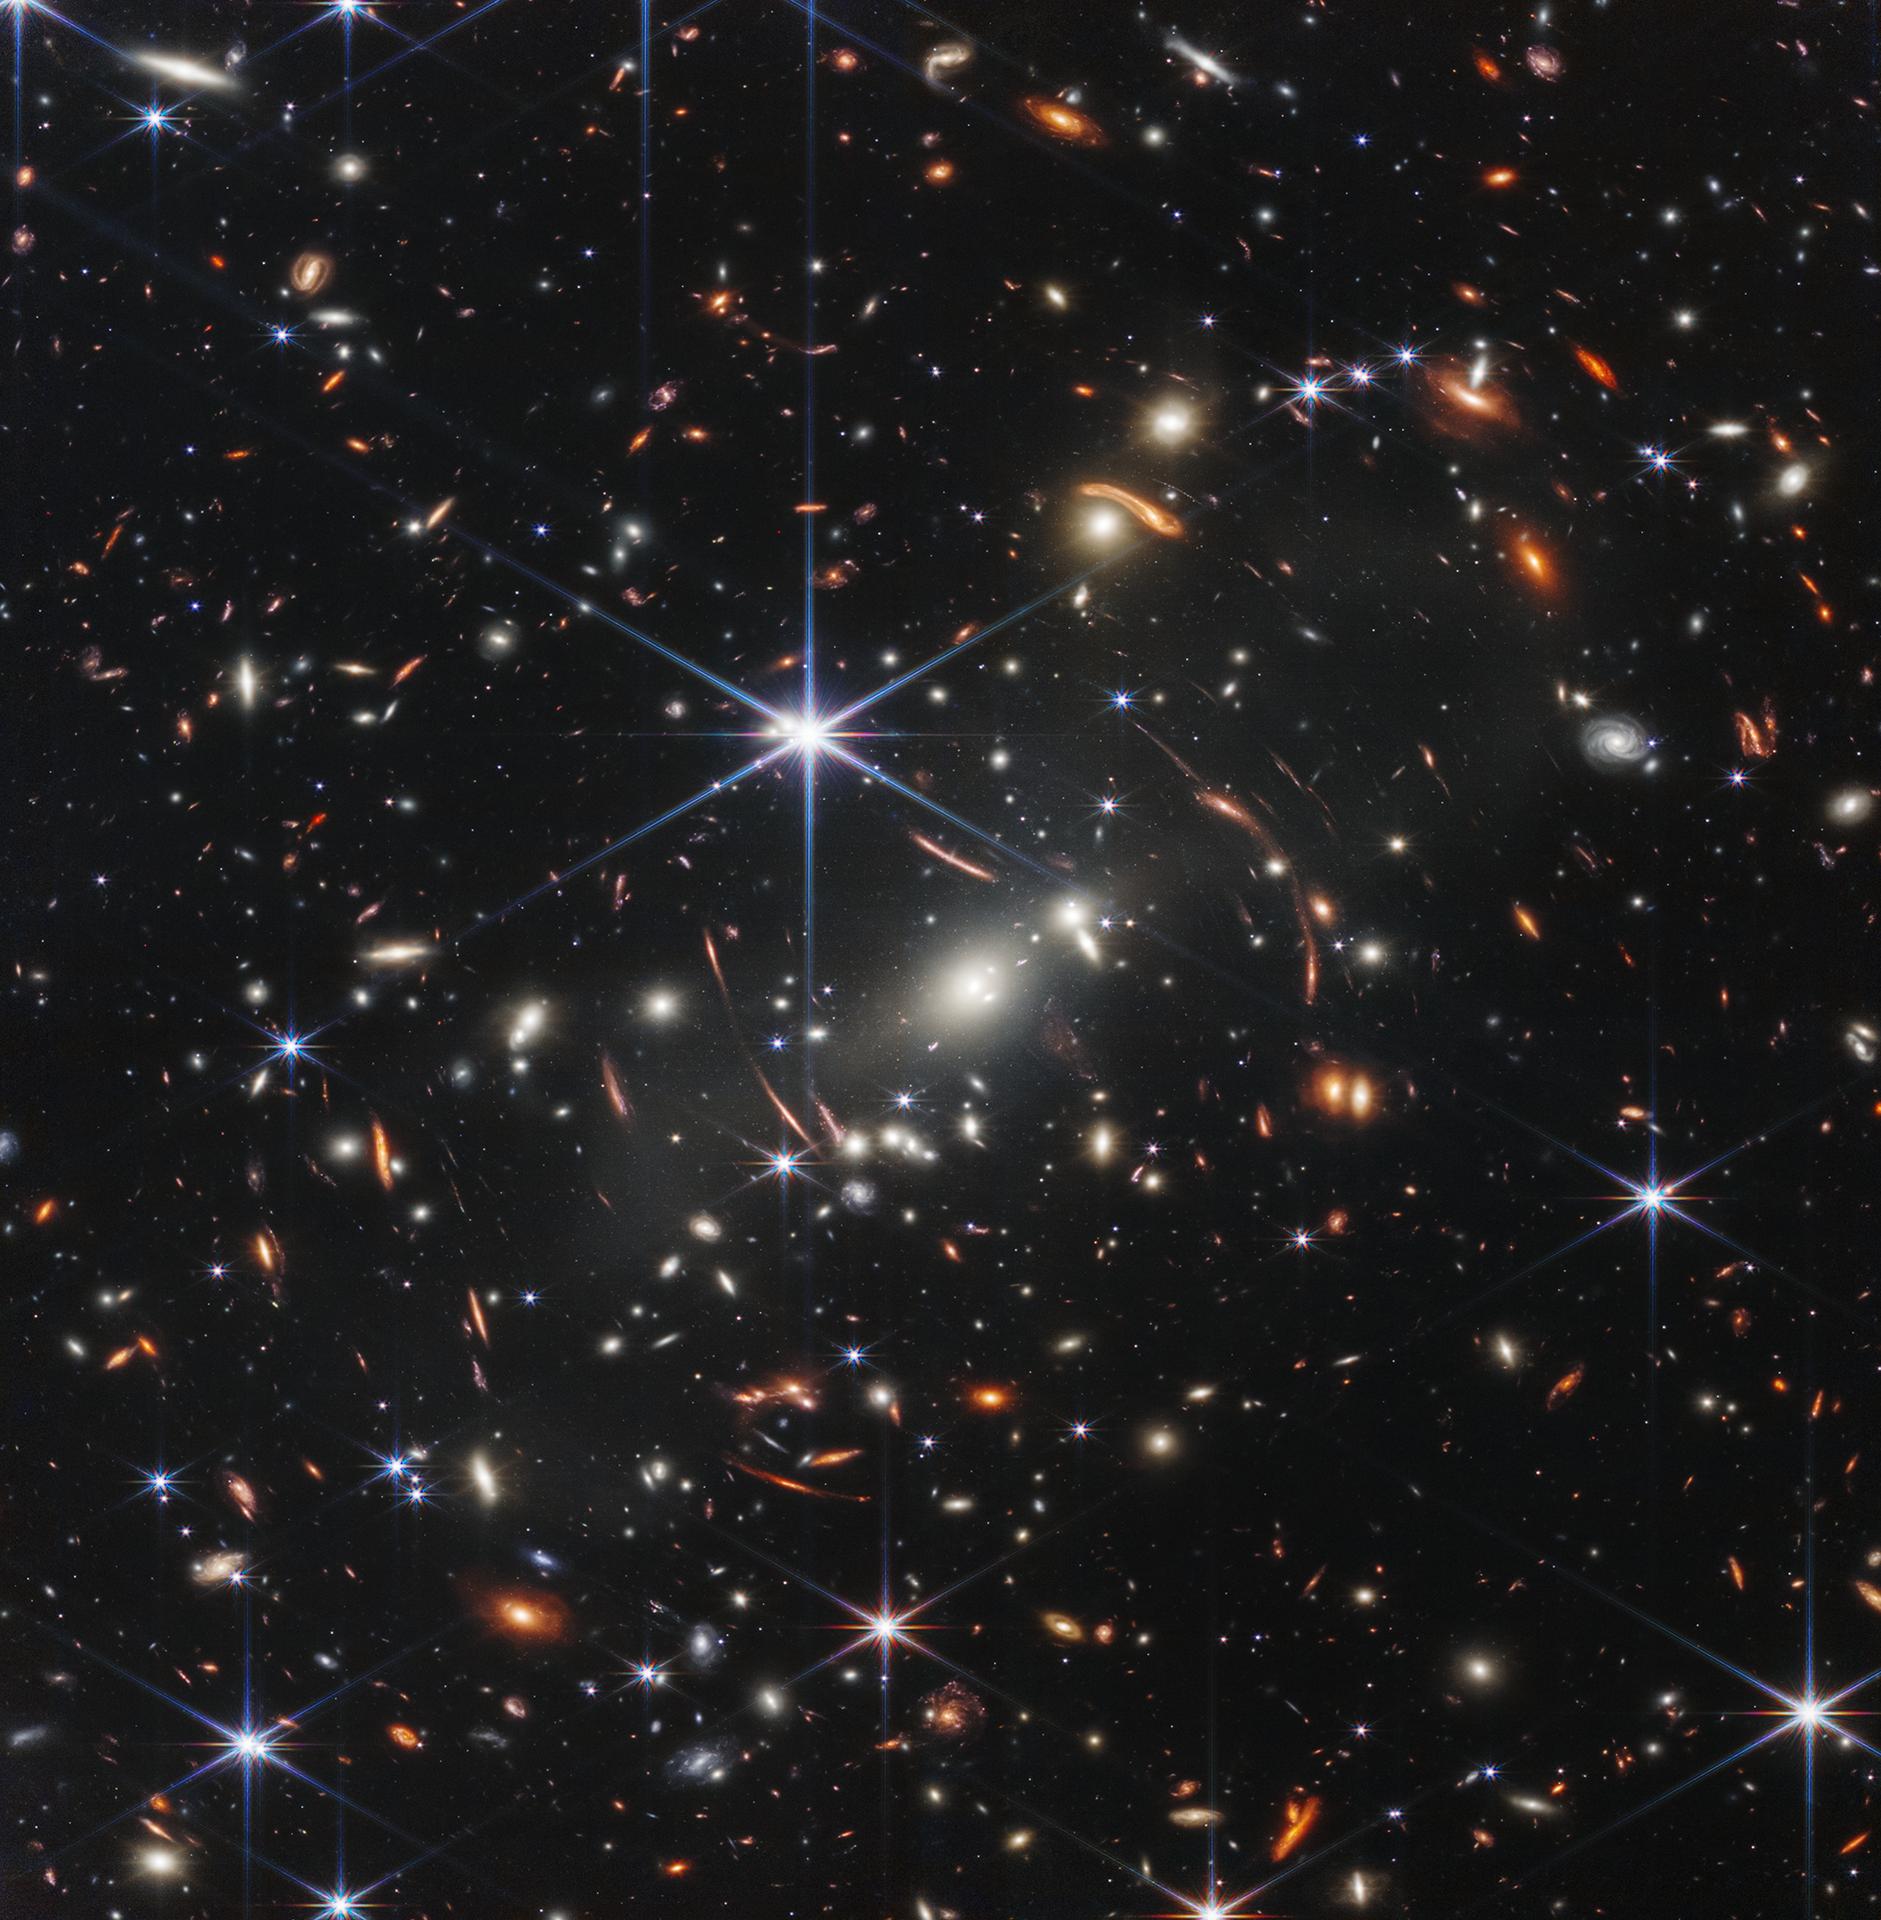
The A map of the universe is a catalogue of measurements, and catalogues come from machines. The last thirty years turned extragalactic astronomy from a discipline of individual objects into one of surveys — millions of galaxies measured the same way, which is what makes statistics about the universe possible at all.
Sloan: the survey that changed the habit
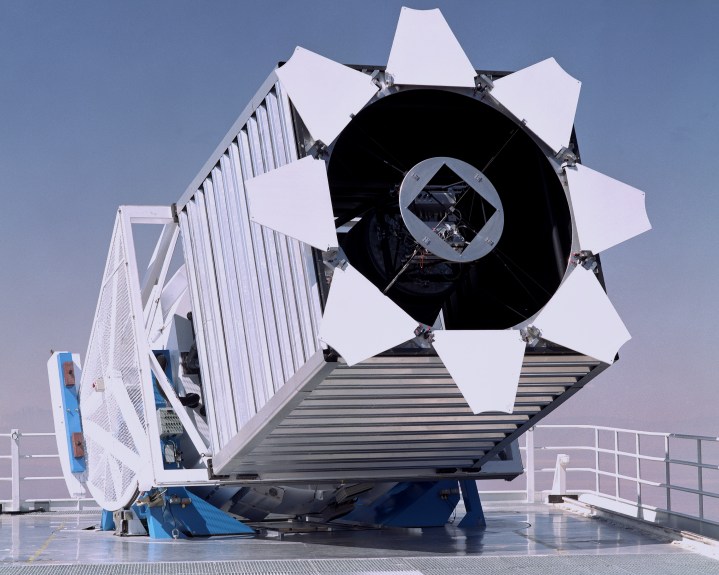
The Sloan Digital Sky Survey began observing in 2000 with a dedicated 2.5-metre telescope at Apache Point and a plan that struck many people as excessive: photograph a third of the sky and take spectra of everything bright enough, whether or not anyone had a question about it. It has now measured spectra for several million objects, and the resulting maps made the cosmic web visible as a statistical object rather than an impression.
Sloan's more lasting effect was cultural. It published its data openly and on a schedule, so the people analysing it were not only the people who built it. Nearly every survey since, including the one behind this atlas, has copied that model.

DESI: the catalog this atlas is built from
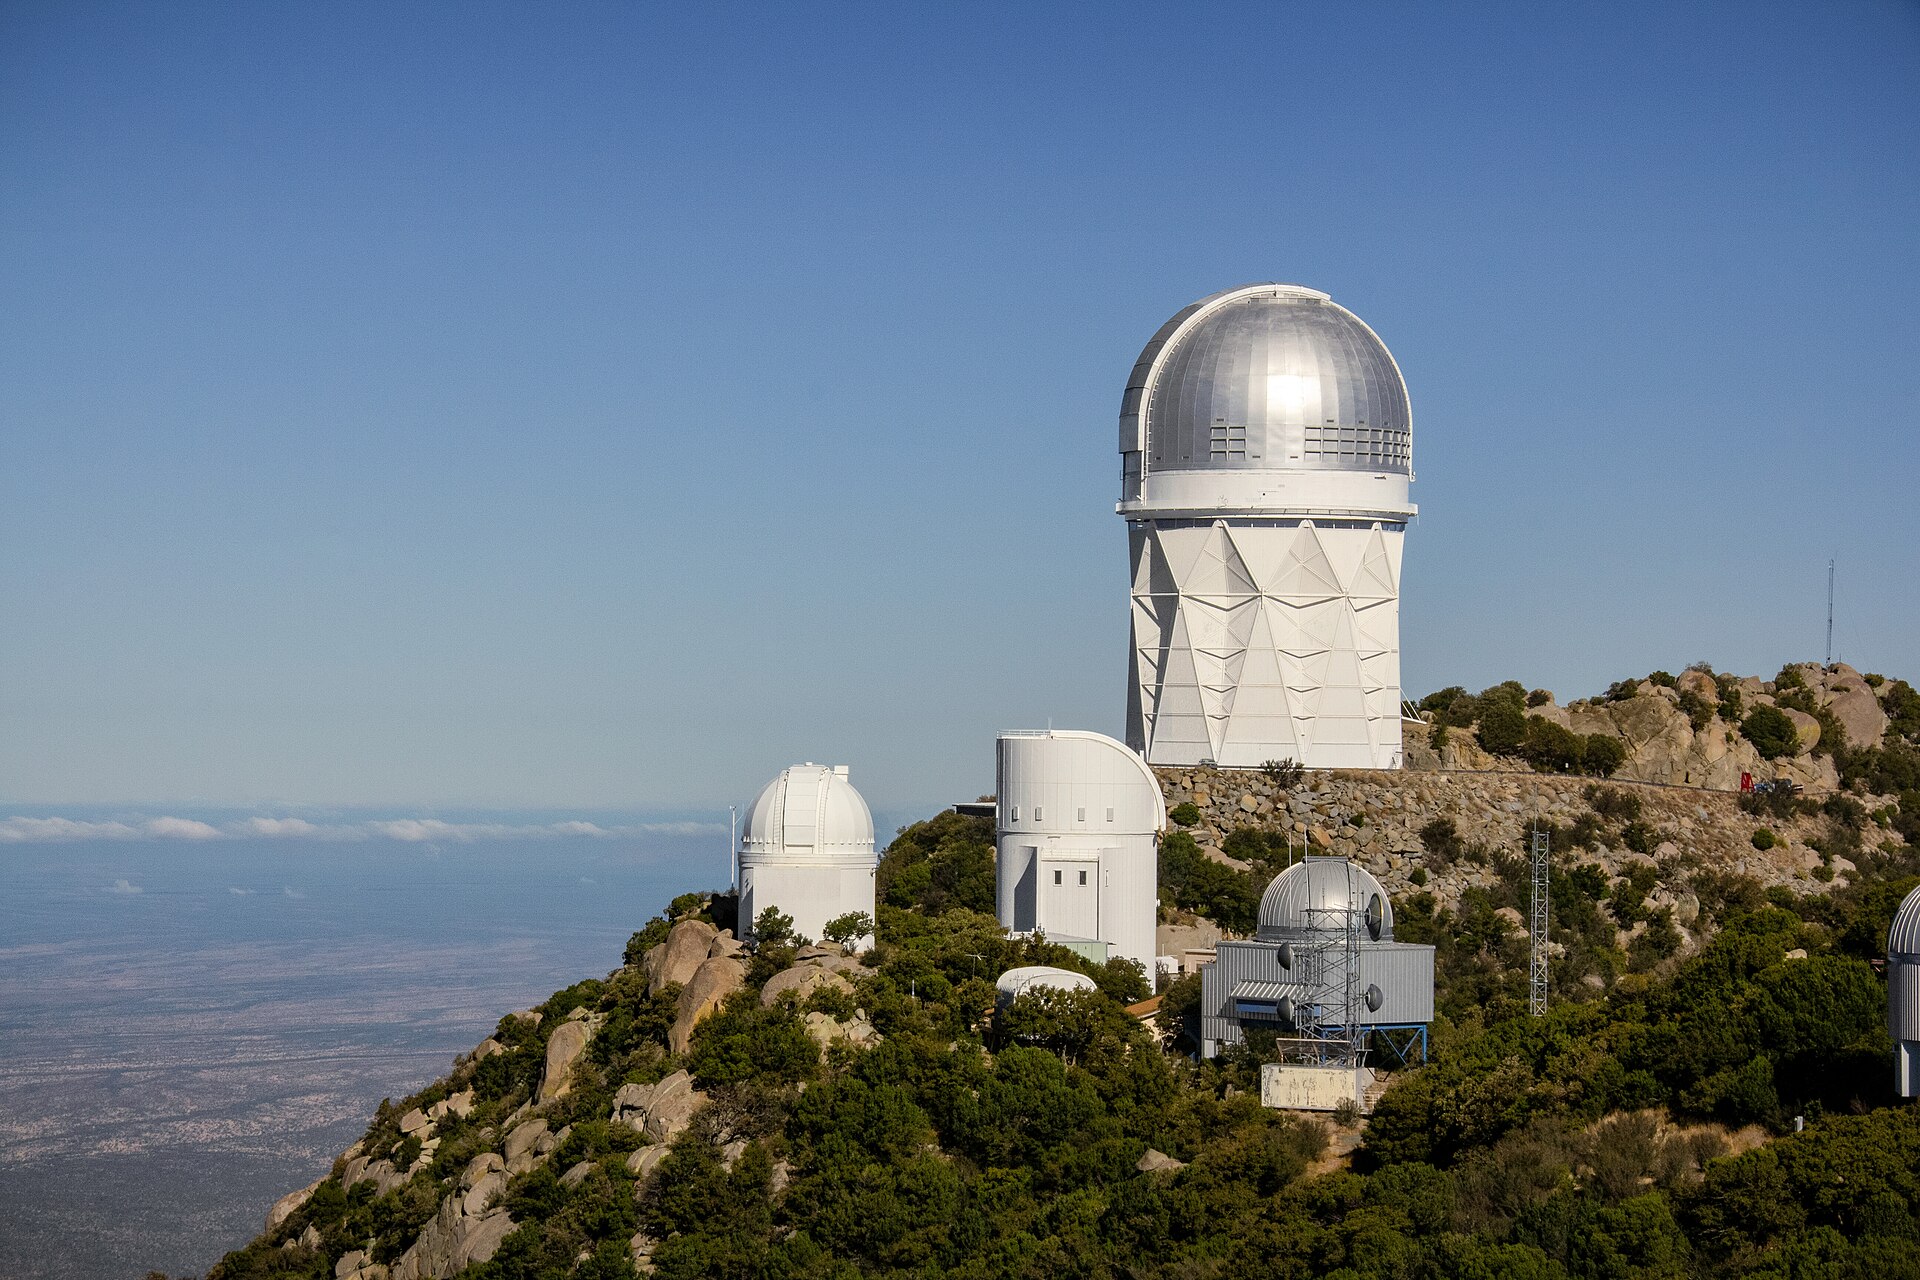
The Dark Energy Spectroscopic Instrument sits on the 4-metre Mayall telescope at Kitt Peak and does one thing extremely well: it points 5,000 optical fibres at 5,000 galaxies at once, robotically repositioning every one of them between exposures. Where earlier surveys drilled a metal plate for each field, DESI reconfigures its focal plane in minutes.
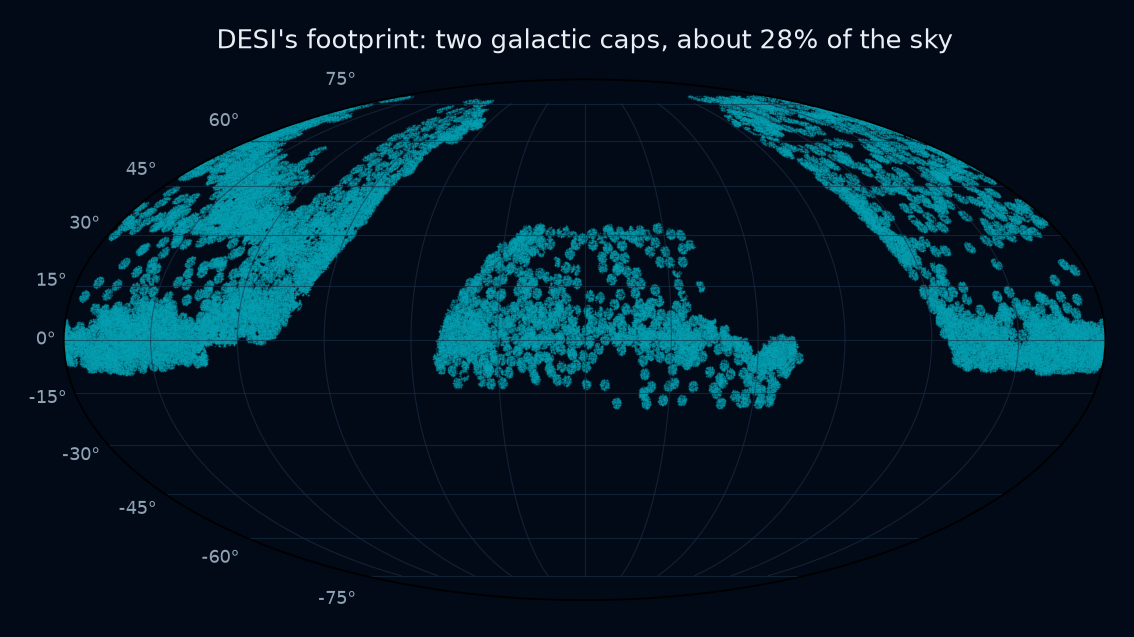
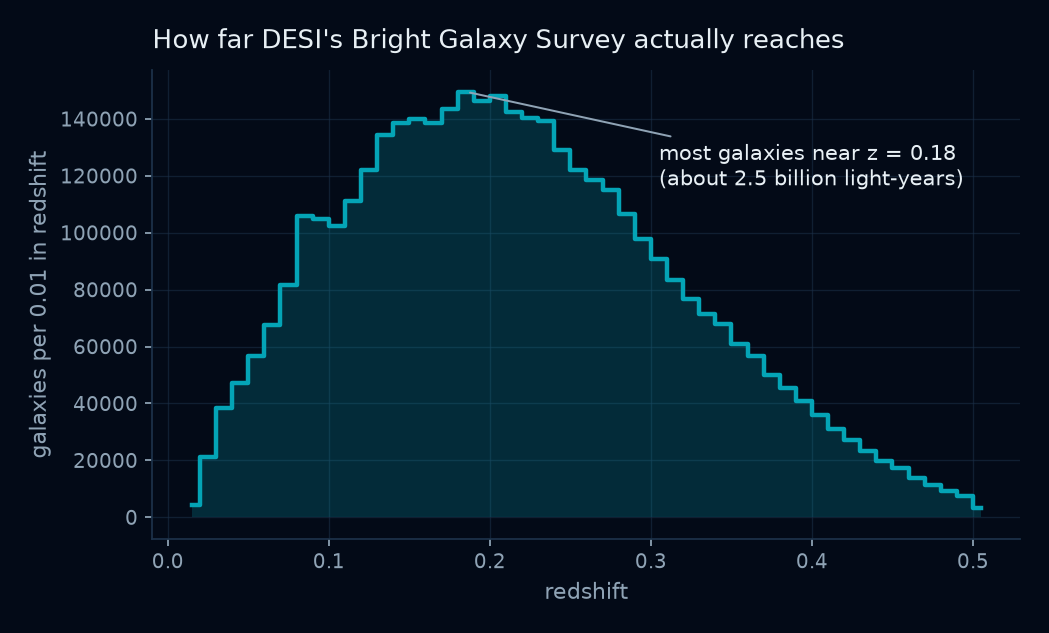
Data Release 1 is what this site maps. Its Bright Galaxy Survey component holds the 3,957,865 galaxies plotted here, covering 0.01 < z < 0.50 across about 28% of the sky, out to 6.3 billion light-years.
The instrument's reach is set by how faint a spectrum it can measure, and that shows up plainly when you count galaxies by redshift. The Bright Galaxy Survey peaks near z = 0.18 and falls away beyond, not because the universe empties but because the telescope runs out of light.
Rubin: the sky as a movie
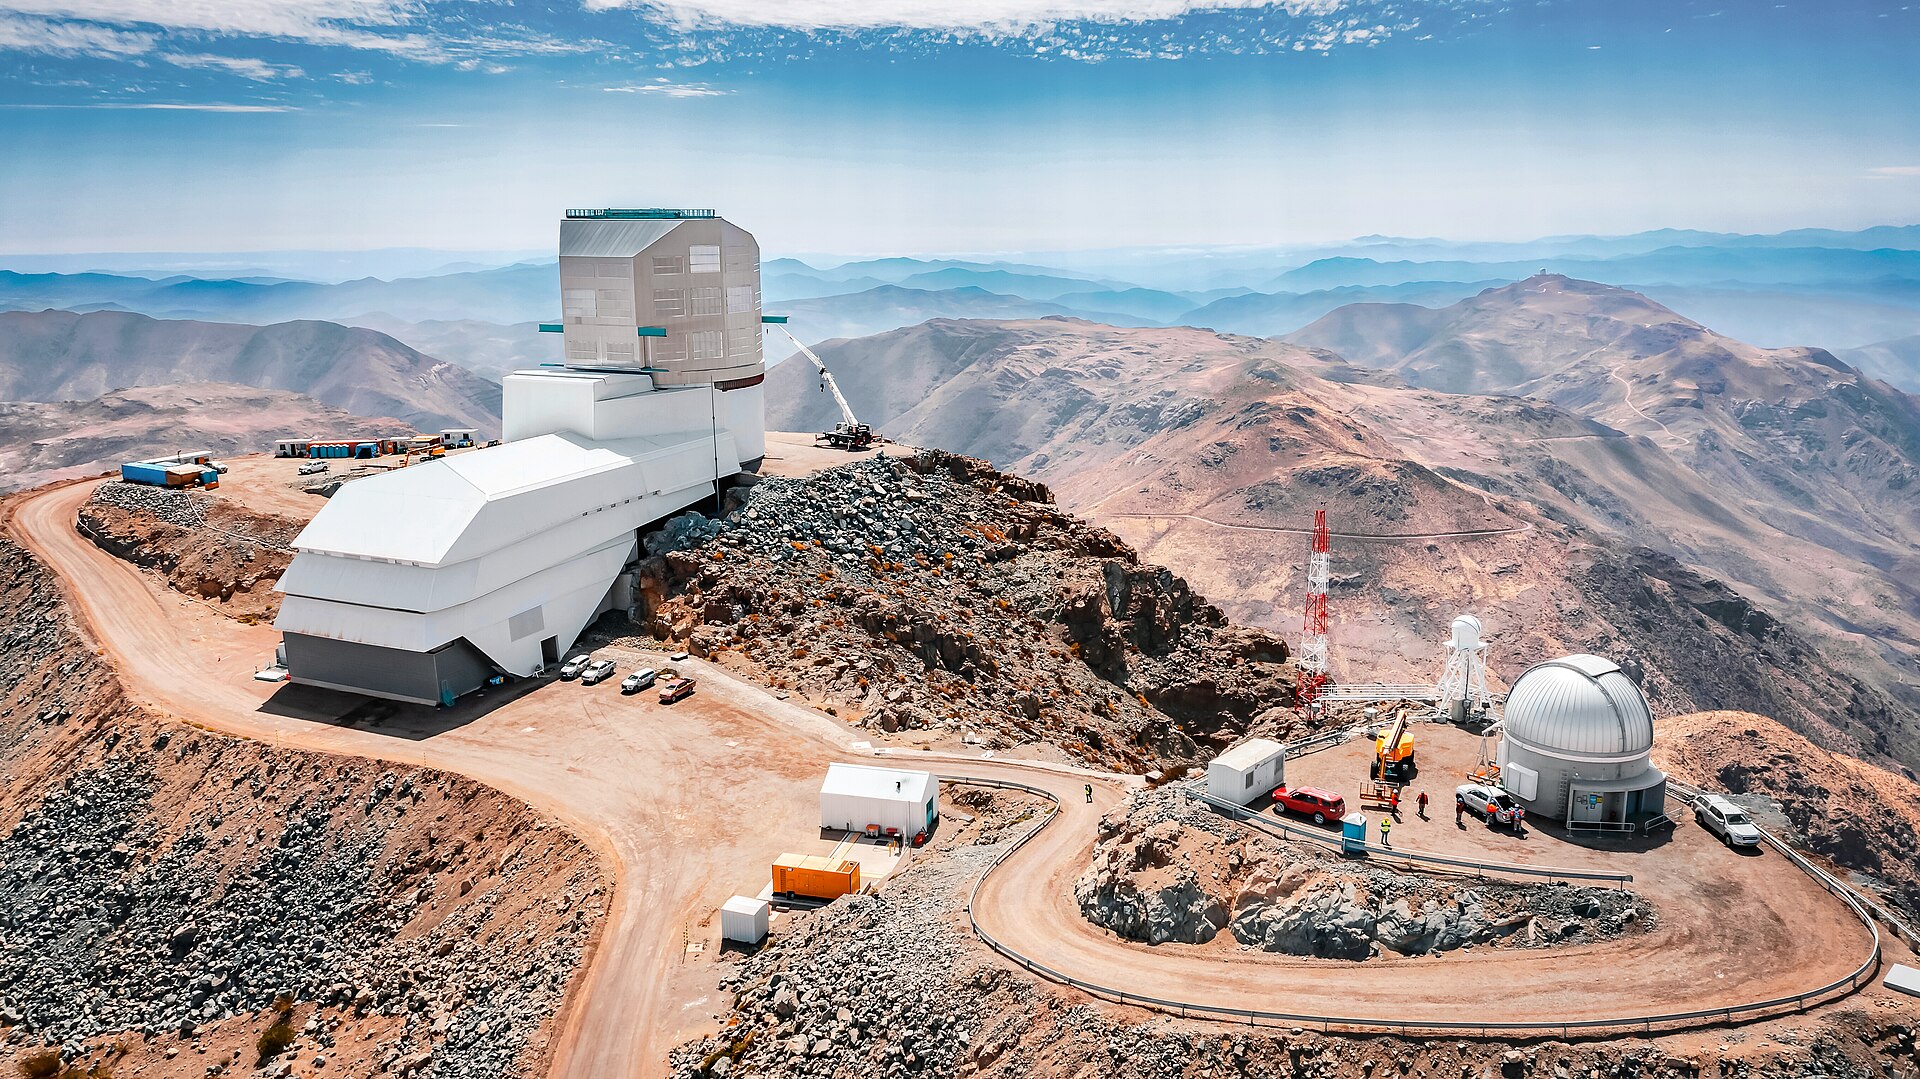
The Vera C. Rubin Observatory in Chile began its Legacy Survey of Space and Time on 30 June 2026, after releasing its first images the previous year, and it changes the question being asked. Rubin's 8.4-metre mirror and 3.2-gigapixel camera — the largest digital camera ever built for astronomy — will image the entire visible southern sky every few nights for ten years, producing something closer to a time-lapse than a photograph.
The expected haul is roughly 20 billion galaxies and a comparable number of stars, with millions of transient alerts every night. That is a change of kind rather than degree: at those rates no human inspects the data, and the scientific instrument is as much the classification software as the telescope. It is also the clearest statement of why this field has become a data science.
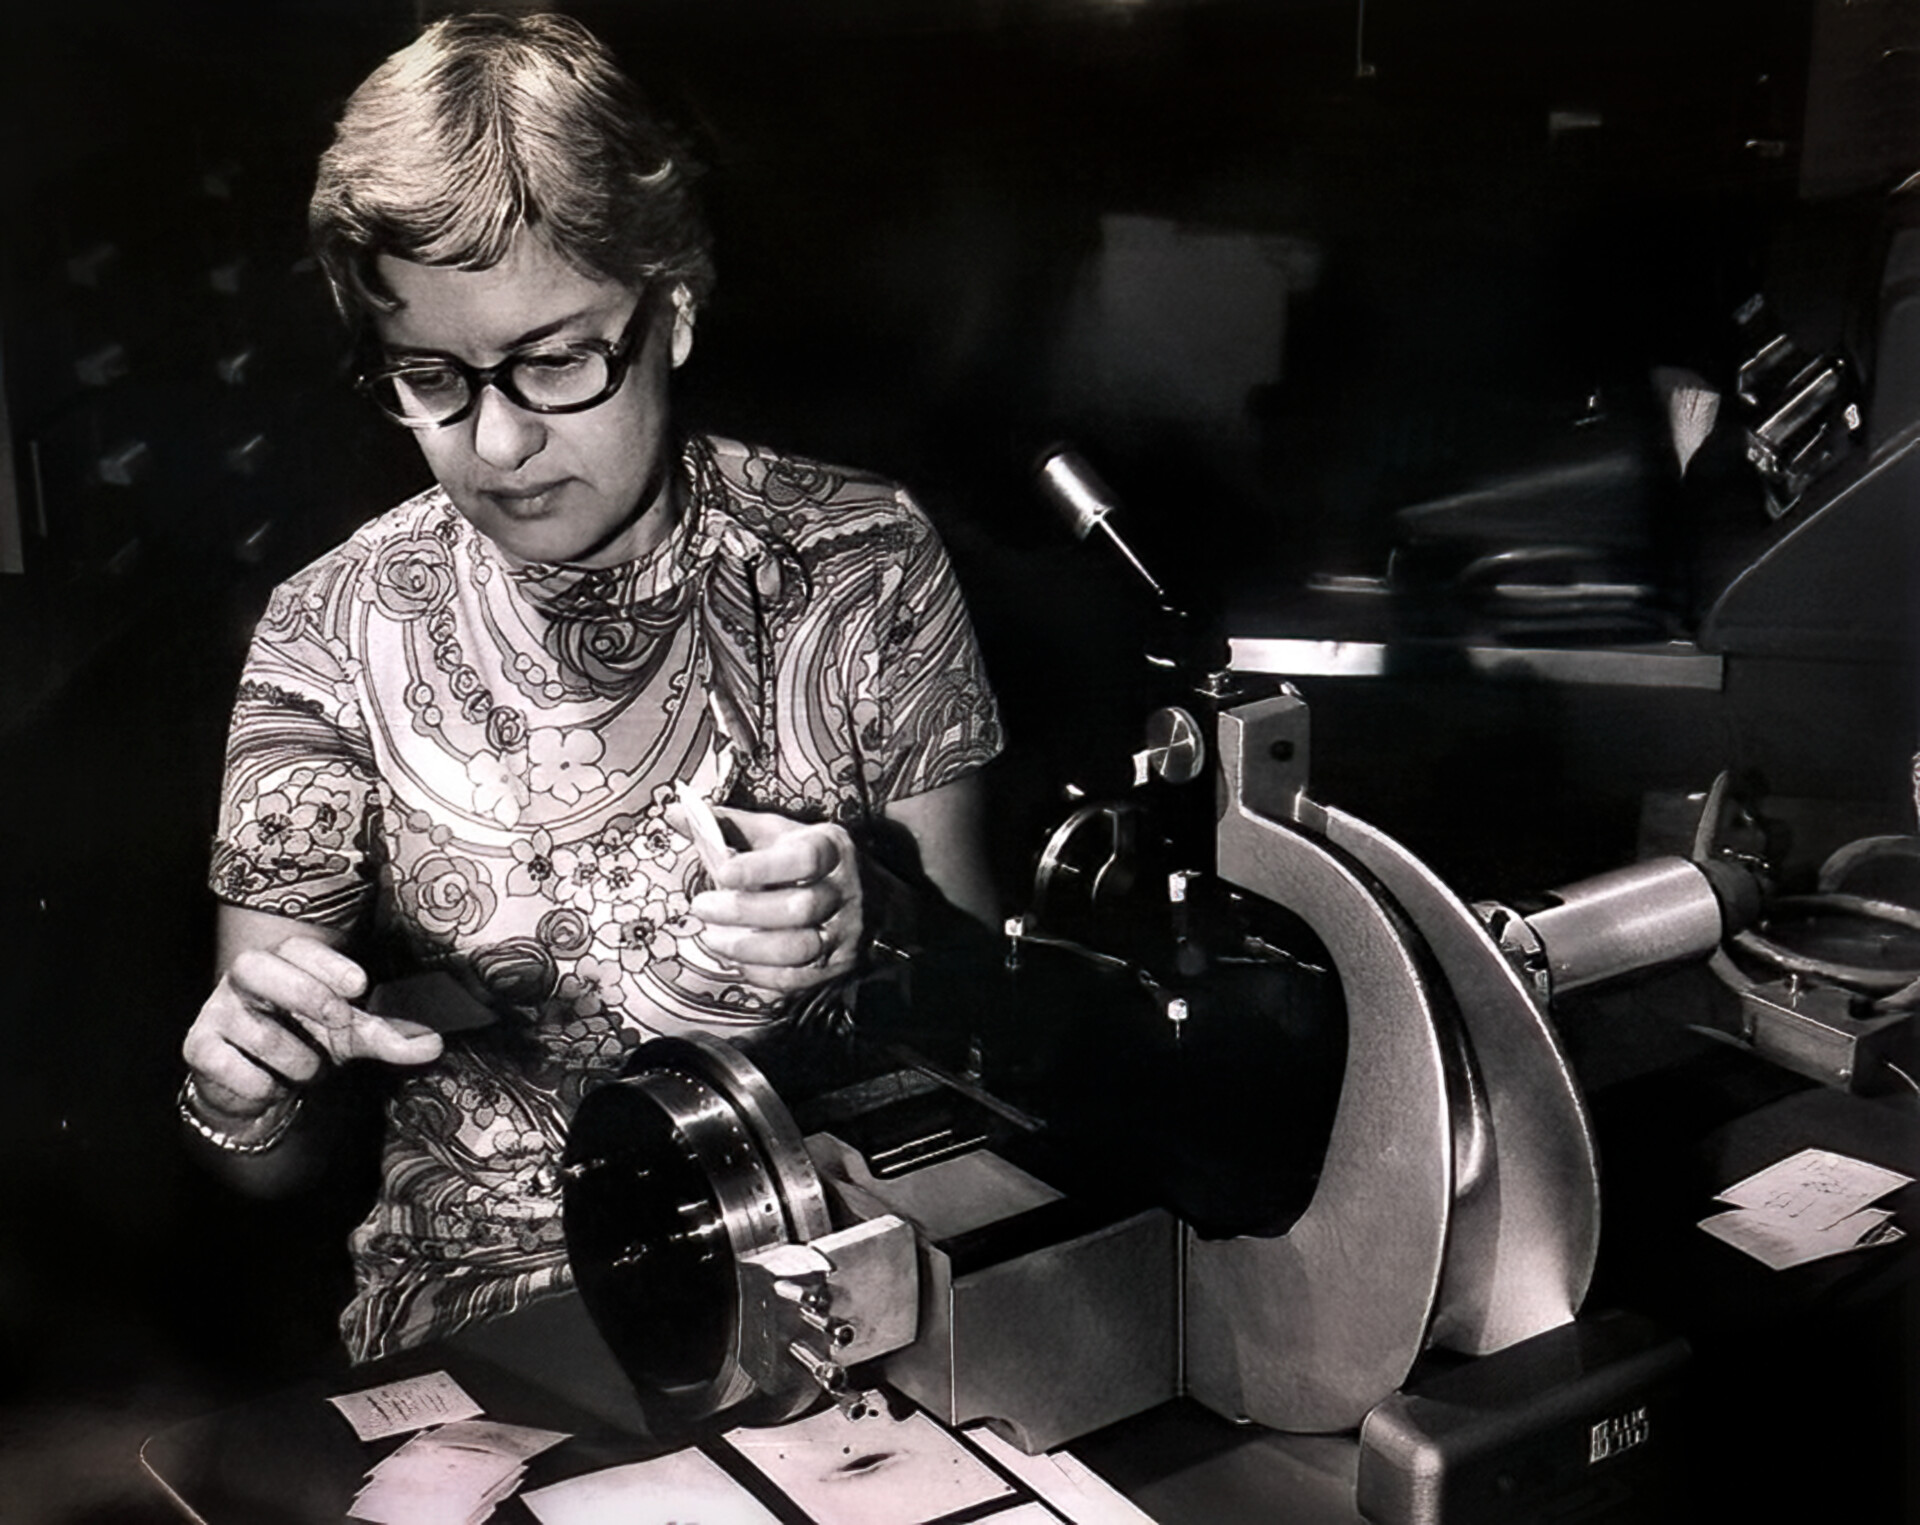
The observatory is named for Vera Rubin, whose rotation-curve measurements in the 1970s showed that galaxies contain far more mass than their light accounts for. Mapping how that invisible mass is distributed is among the survey's central goals — a reasonable memorial.

What surveys share
These instruments differ in almost every respect but agree on the thing that matters for a site like this one: they measure a defined sample in a defined way and publish it. That is what lets someone with a laptop rebuild a Hubble diagram, find galaxy groups, or plot four million galaxies in a browser — none of which requires access to a telescope, only to a catalogue and the patience to read its documentation.
It also imposes a discipline. A published survey comes with its selection function, its footprint and its completeness, and using it honestly means carrying those limits into every claim you make from it. Most of the caveats on this site are not modesty; they are the survey's own documentation, restated.
See how the distances are calibrated, or open the map that DESI's catalog makes.