 The
The Matter in the universe is organised on a ladder: galaxies bind into groups, groups into clusters, clusters string along filaments, and the filaments wrap around voids that fill most of space. Every rung of that ladder is visible in this catalog, and this page walks up it using nothing but 3,957,865 DESI galaxies.
Galaxies
The bottom rung. A galaxy is a gravitationally bound collection of stars, gas, dust and dark matter, and for the purposes of a map like this one it is a single point: a position on the sky and a redshift. This catalog holds 3,957,865 of them, out to 6.3 billion light-years.
They are not anonymous. Cross-matching against HyperLEDA gives 486,546 of them a catalogue identity, 134,843 of those a morphological type — spiral, elliptical, irregular — and 2,225 a designation you can type into the map's search box and fly to.
Groups and clusters
Galaxies are social. Left alone under gravity for thirteen billion years, they fall towards one another and end up in bound systems: a pair, a handful, a few dozen, occasionally a thousand. Finding those systems in a catalog is a data-mining problem, and the classical solution is friends-of-friends: link every pair of galaxies closer than some distance, then call each connected clump a group.
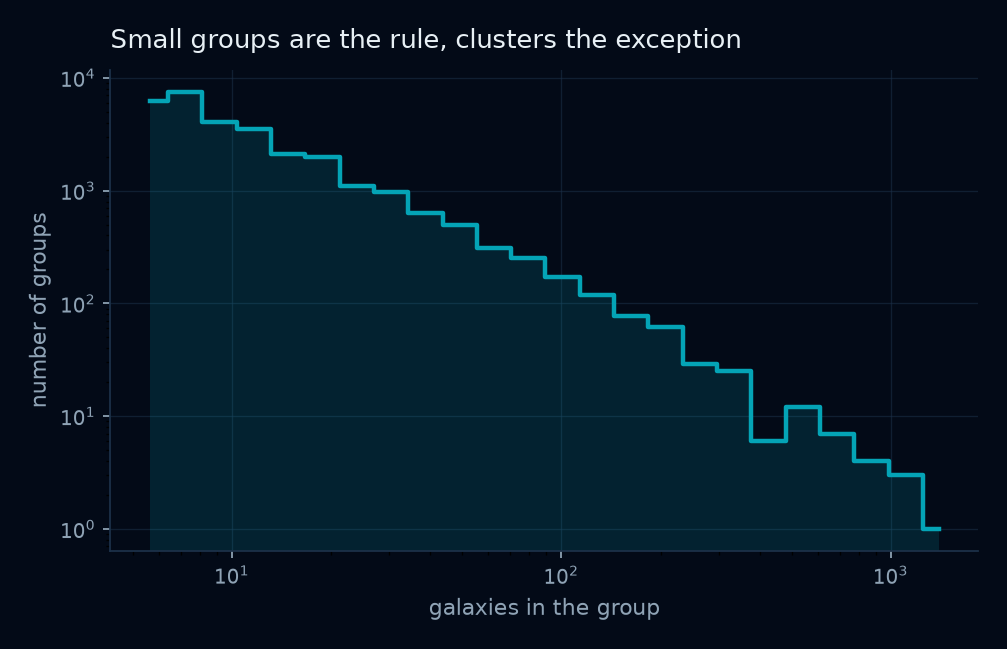
Run on this catalog between z = 0.01 and z = 0.15, it finds 39,328 systems containing 529,866 galaxies — 44% of every galaxy in that range. The median system has 7 members. The largest has 2,007. 1,278 have fifty or more, which is where astronomers stop saying "group" and start saying "cluster".
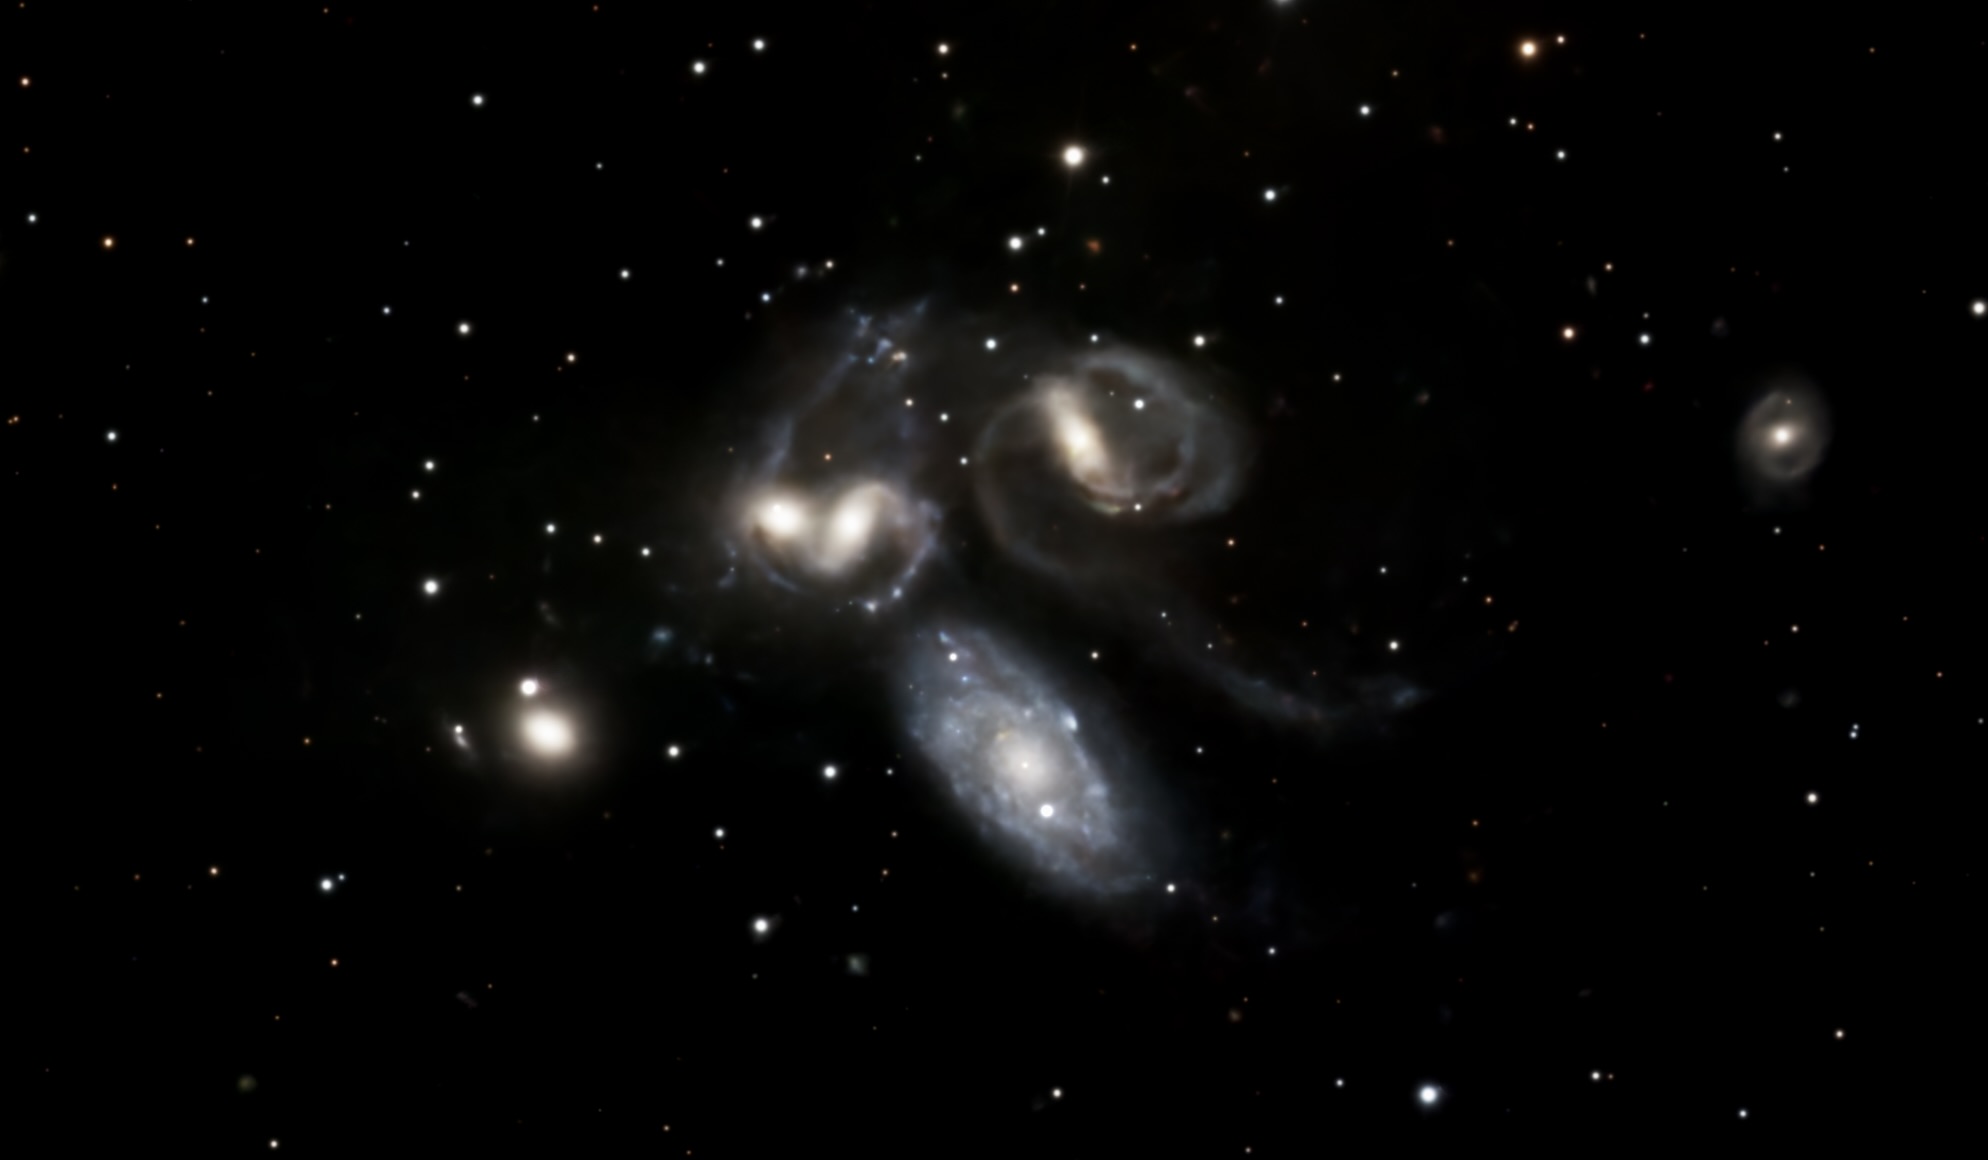
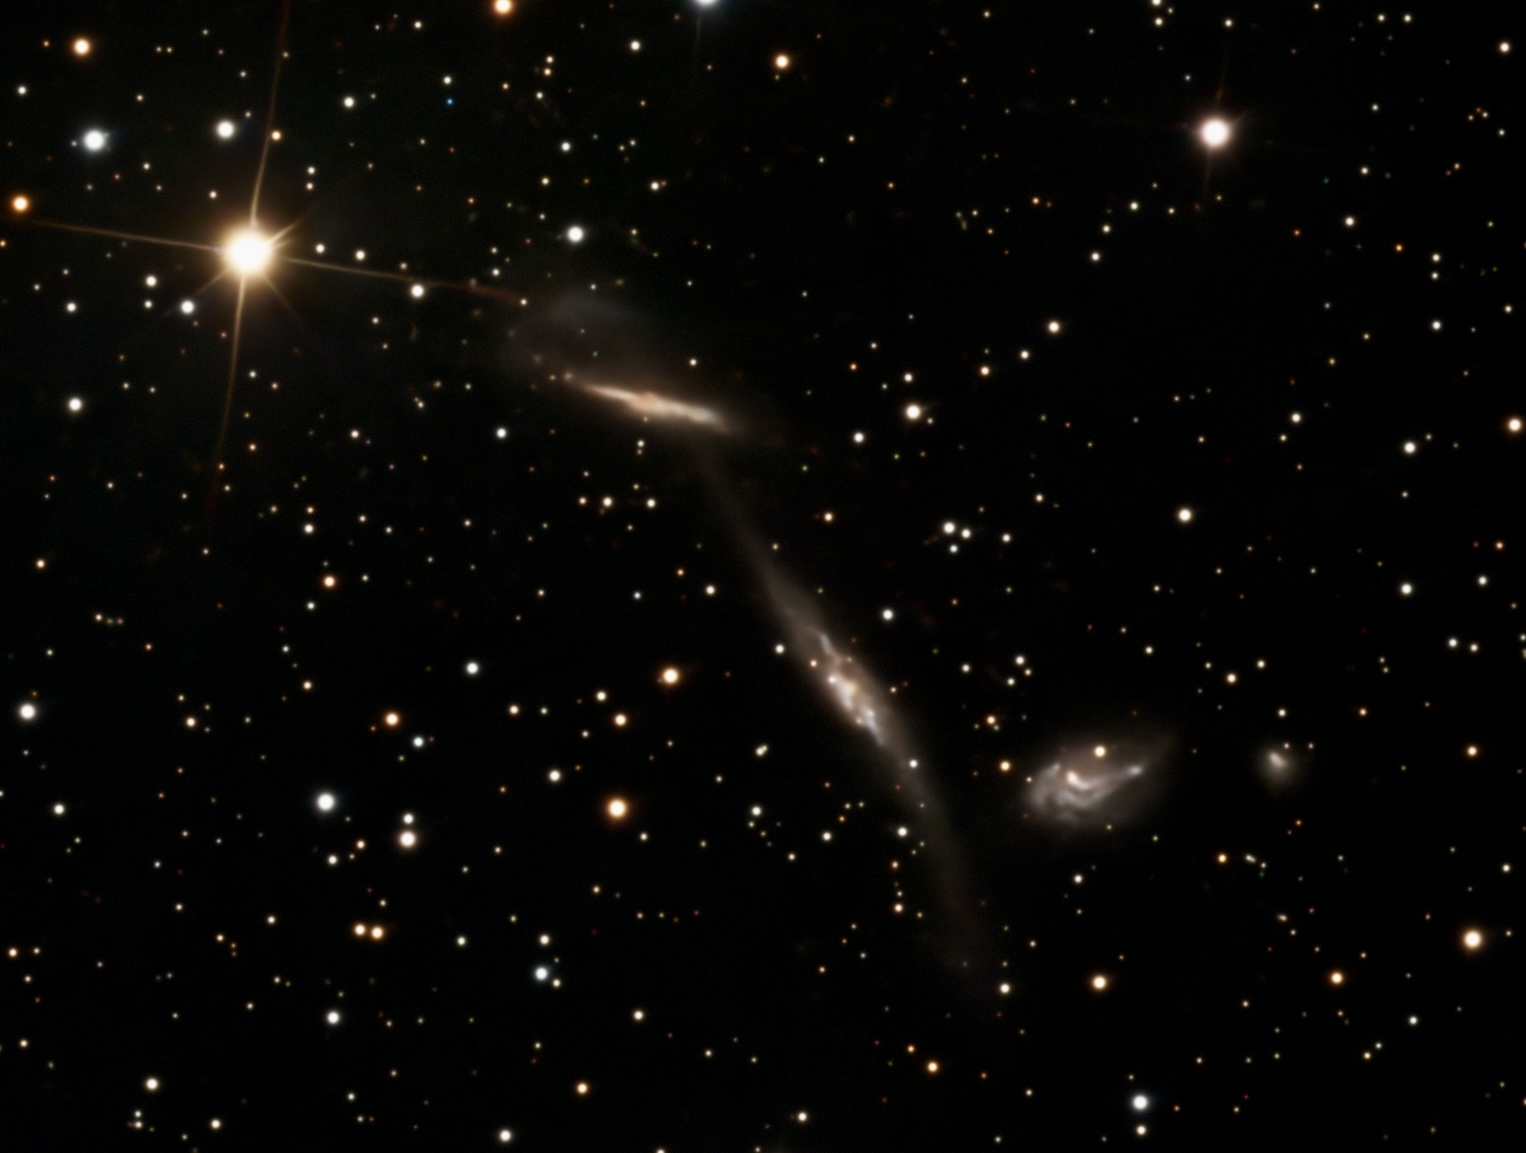
Groups are not always obvious. Some are compact knots like the Quintet; others announce themselves only by the damage — a bridge of stars pulled between two discs, or a tail flung out by a pass that happened hundreds of millions of years ago and is still unwinding.
Weighing a cluster you cannot touch
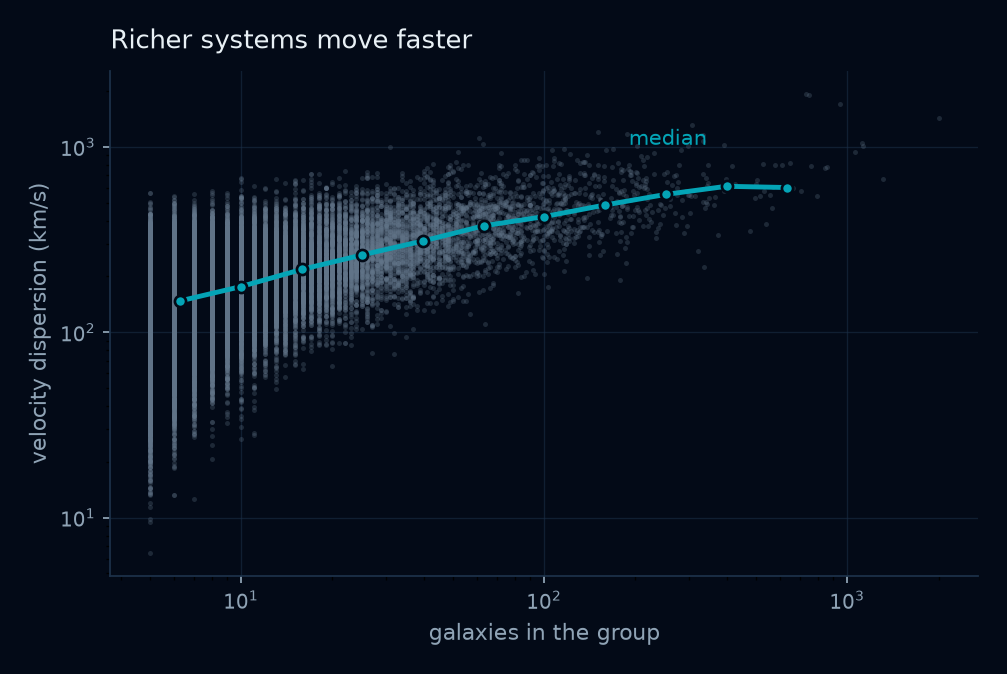
Here is where a catalog stops being a list and starts being physics. The galaxies in a bound system orbit their common centre of mass, so their redshifts scatter around the system's average. That scatter — the velocity dispersion — is set by how much mass is pulling on them. A heavier system makes its members move faster.
So the prediction is simple: richer systems should show larger dispersions. The catalog agrees. Across 39,328 groups the median dispersion climbs from about 147 km/s for the smallest systems to 602 km/s for the richest — a relation nobody put into the data, recovered from redshifts alone.
Filaments, walls and voids
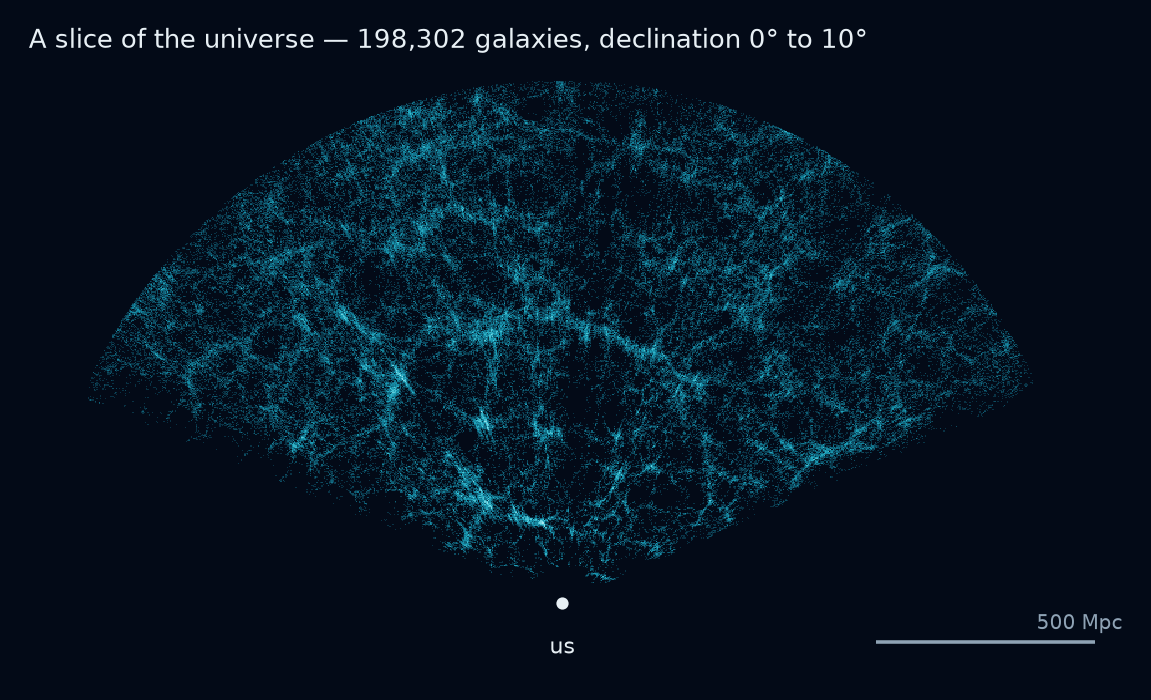
Above clusters the structure stops being bound. Filaments and walls are not objects orbiting a centre; they are the pattern left behind as matter drains out of the emptying regions and onto the dense ones. Look again at the slice at the top of this page: the bright ridges are filaments seen in projection, the blank regions are voids, and the voids are the majority of the volume.
This is the cosmic web, and its shape is a fossil. The pattern grew from density ripples already imprinted when the universe was a few hundred thousand years old — the same ripples visible in the cosmic microwave background. Gravity has been amplifying them ever since, draining the underdense regions and piling matter onto the overdense ones.
Two things the picture gets wrong
Both are worth knowing before reading structure off any redshift map, including this one.
Fingers of God. A galaxy's own motion adds to its redshift, so in a cluster — where motions are fastest — members are smeared along the line of sight into a spike pointing at the observer. Those radial streaks in the slice are not filaments. They are the same velocity dispersion that let us weigh the cluster, now corrupting its shape.
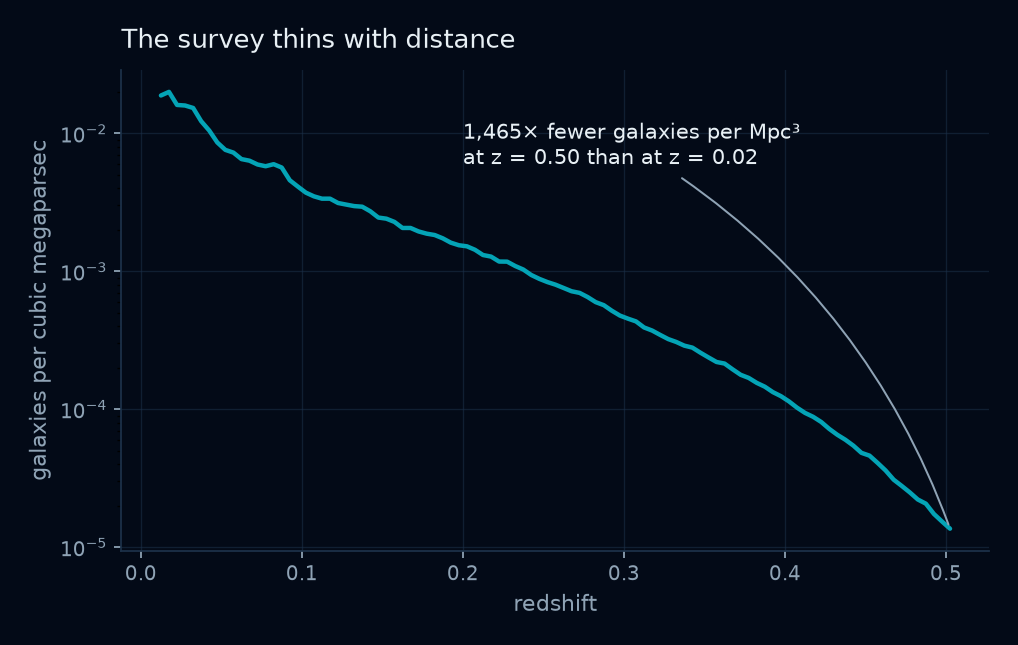
The survey thins with distance. A brightness-limited survey sees only the intrinsically luminous galaxies far away, so the apparent emptying of the map with distance is mostly the telescope running out of reach.
The map is the place to go next: the same 39,328 groups are drawn over the point cloud as an optional layer, and the richest are labelled.